Last few years I observed that the biggest of all debates that occur during the course of a project is during the sizing of the stories. Most of the times in the teams I have worked we had fibonacci or t-shirt sizing and sometimes 1,2,4,8. We humans are not so good when we deal with numbers which are closely spaced. T-shirt sizes are also closely spaced S,M,L loosely translates to 38, 40, 42. This leads to people arguing whether some stories is of 2 or 3 points or Small or medium size and gets into tasking and implementation details to get the right size.
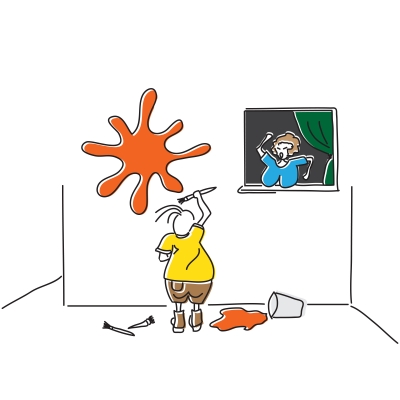
When I was thinking about a better method for sizing, I read in some feed that a person tried to use reptile sizes like gecko, iguana, alligator and komodo. Each different in size and class from the other. I thought, let me also give a try and then came up with Scooter, Car and Bus for the sizes with Bicycle and Trailer as outliers (similar to XS or XL in t-shirt sizes). To my surprise it was too easy for people to slot the stories into one of these sizes and there were very few arguments and a simple task break down of a story gave a picture of the size/complexity. This worked much better than S,M,L or 1,2,3,5,8.
What happens when creating things becomes very easy? People will create things just for the sake of creating something without careful consideration. The best example I could see is the mobile phone app stores, within a few hours we could create an application and that made people flood the app stores with lots and lots of spammy products. Google had no other option than to intervene and remove ‘Low quality’ apps from Google play to tackle this. Still the number of apps available on the app store is so huge (600,000+ ) that it is not at all meaningful to go through lists and choose what suits us.
A twentieth century problem is that technology has become too “easy”. When it was hard to do anything whether good or bad, enough time was taken so that the result was usually good. Now we can make things almost trivially, especially in software, but most of the designs are trivial as well. This is inverse vandalism: the making of things because you can. Couple this to even less sophisticated buyers and you have generated an exploitation marketplace similar to that set up for teenagers. A counter to this is to generate enormous disatisfaction with one’s designs using the entire history of human art as a standard and goal. Then the trick is to decouple the disatisfaction from self worth–otherwise it is either too depressing or one stops too soon with trivial results.
This is not just applicable to creating software programs, it is applicable in places where automation and mass production is present in any form. We as consumers also tend to buy more of the same product once it becomes cheaper than buying something else with the saved money. This is illustrated by Jevons Paradox, technological progress that increases the efficiency with which a resource is used tends to increase (rather than decrease) the rate of consumption of that resource.
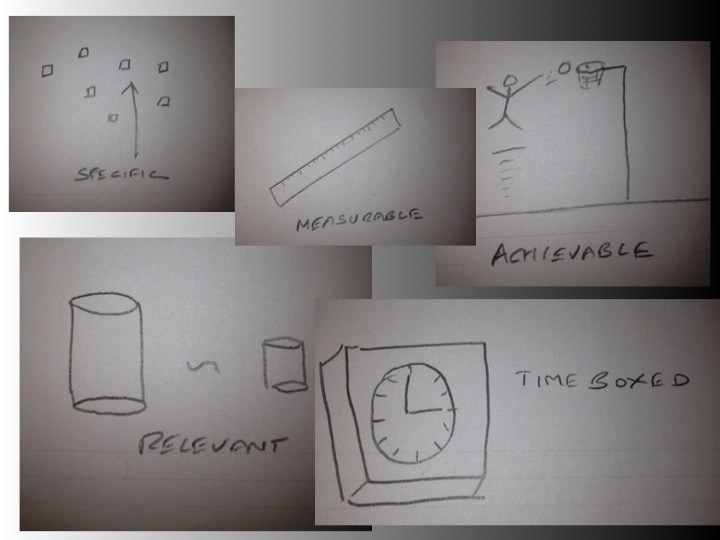
I often stumbled on the phrase ‘A picture is worth 1000 words’; but it never occurred to me that I could take notes in the form of pictures until I read the book “The Back of the Napkin”. I came across the acronym SMART many times in many reading materials but I found it difficult to recollect. From the learnings of the book “The Back of the Napkin” I took notes in the form of doodles and I was able to recollect it easily. Here is my doodle.
I also noted that drawing doodles or mindmaps during meetings helped me to concentrate a lot, an explanation given to that kind of concentration is that I am a visual learner; other types of learners are auditory and kinesthetic. Doodling consumes some resources of my brain such that it does not allow me to day dream and helps me stay focussed; also as a side effect it helps me recollect information much better. If you are a visual learner try your hands on doodles, this place could be one of your starting points – braindoodles.net. As per that website we remember just 10% of what we read but 90% of what we see.